The ION Smart Digital Platform empowers users to extract valuable insights and analyze data conveniently by building reports. This guide will walk you through the process of creating reports tailored to your specific needs.
Before diving into the report-building process, it's crucial to identify your objectives and determine what insights you aim to gain from the report. Consider the following questions:
What data points or metrics do you want to include in the report?
What is the purpose of the report? Is it for monitoring, analysis, or presentation?
Who is the intended audience for the report?
Locate the report-building feature within the app as shown.
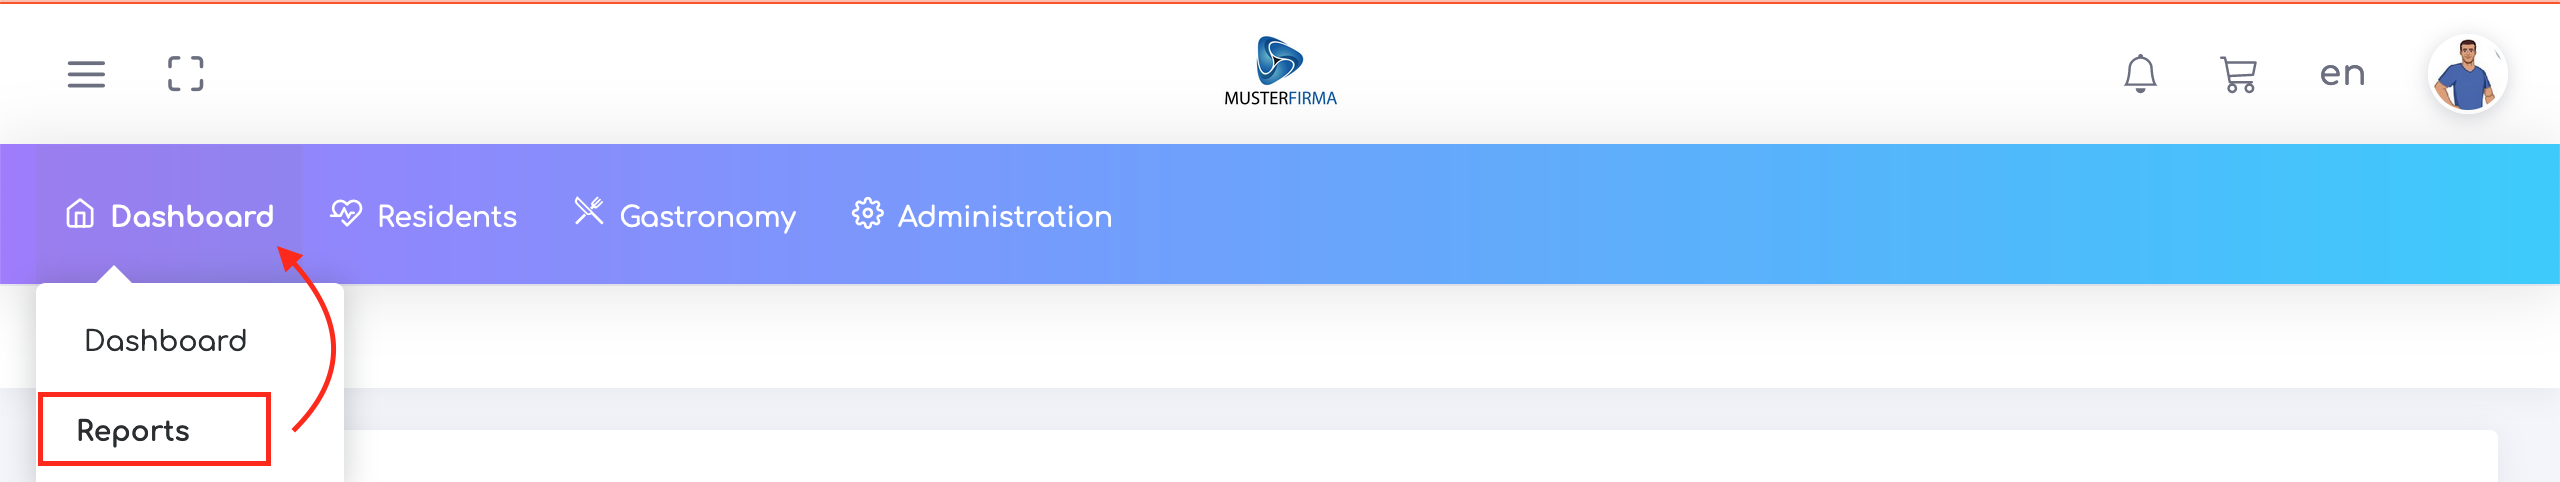
If the Dashboard App is not visible or if the Reports option is not present within the Dashboard App, request your Administrator to provide you with the necessary authorizations.
If you're having trouble still finding it, reach out to customer support for assistance.
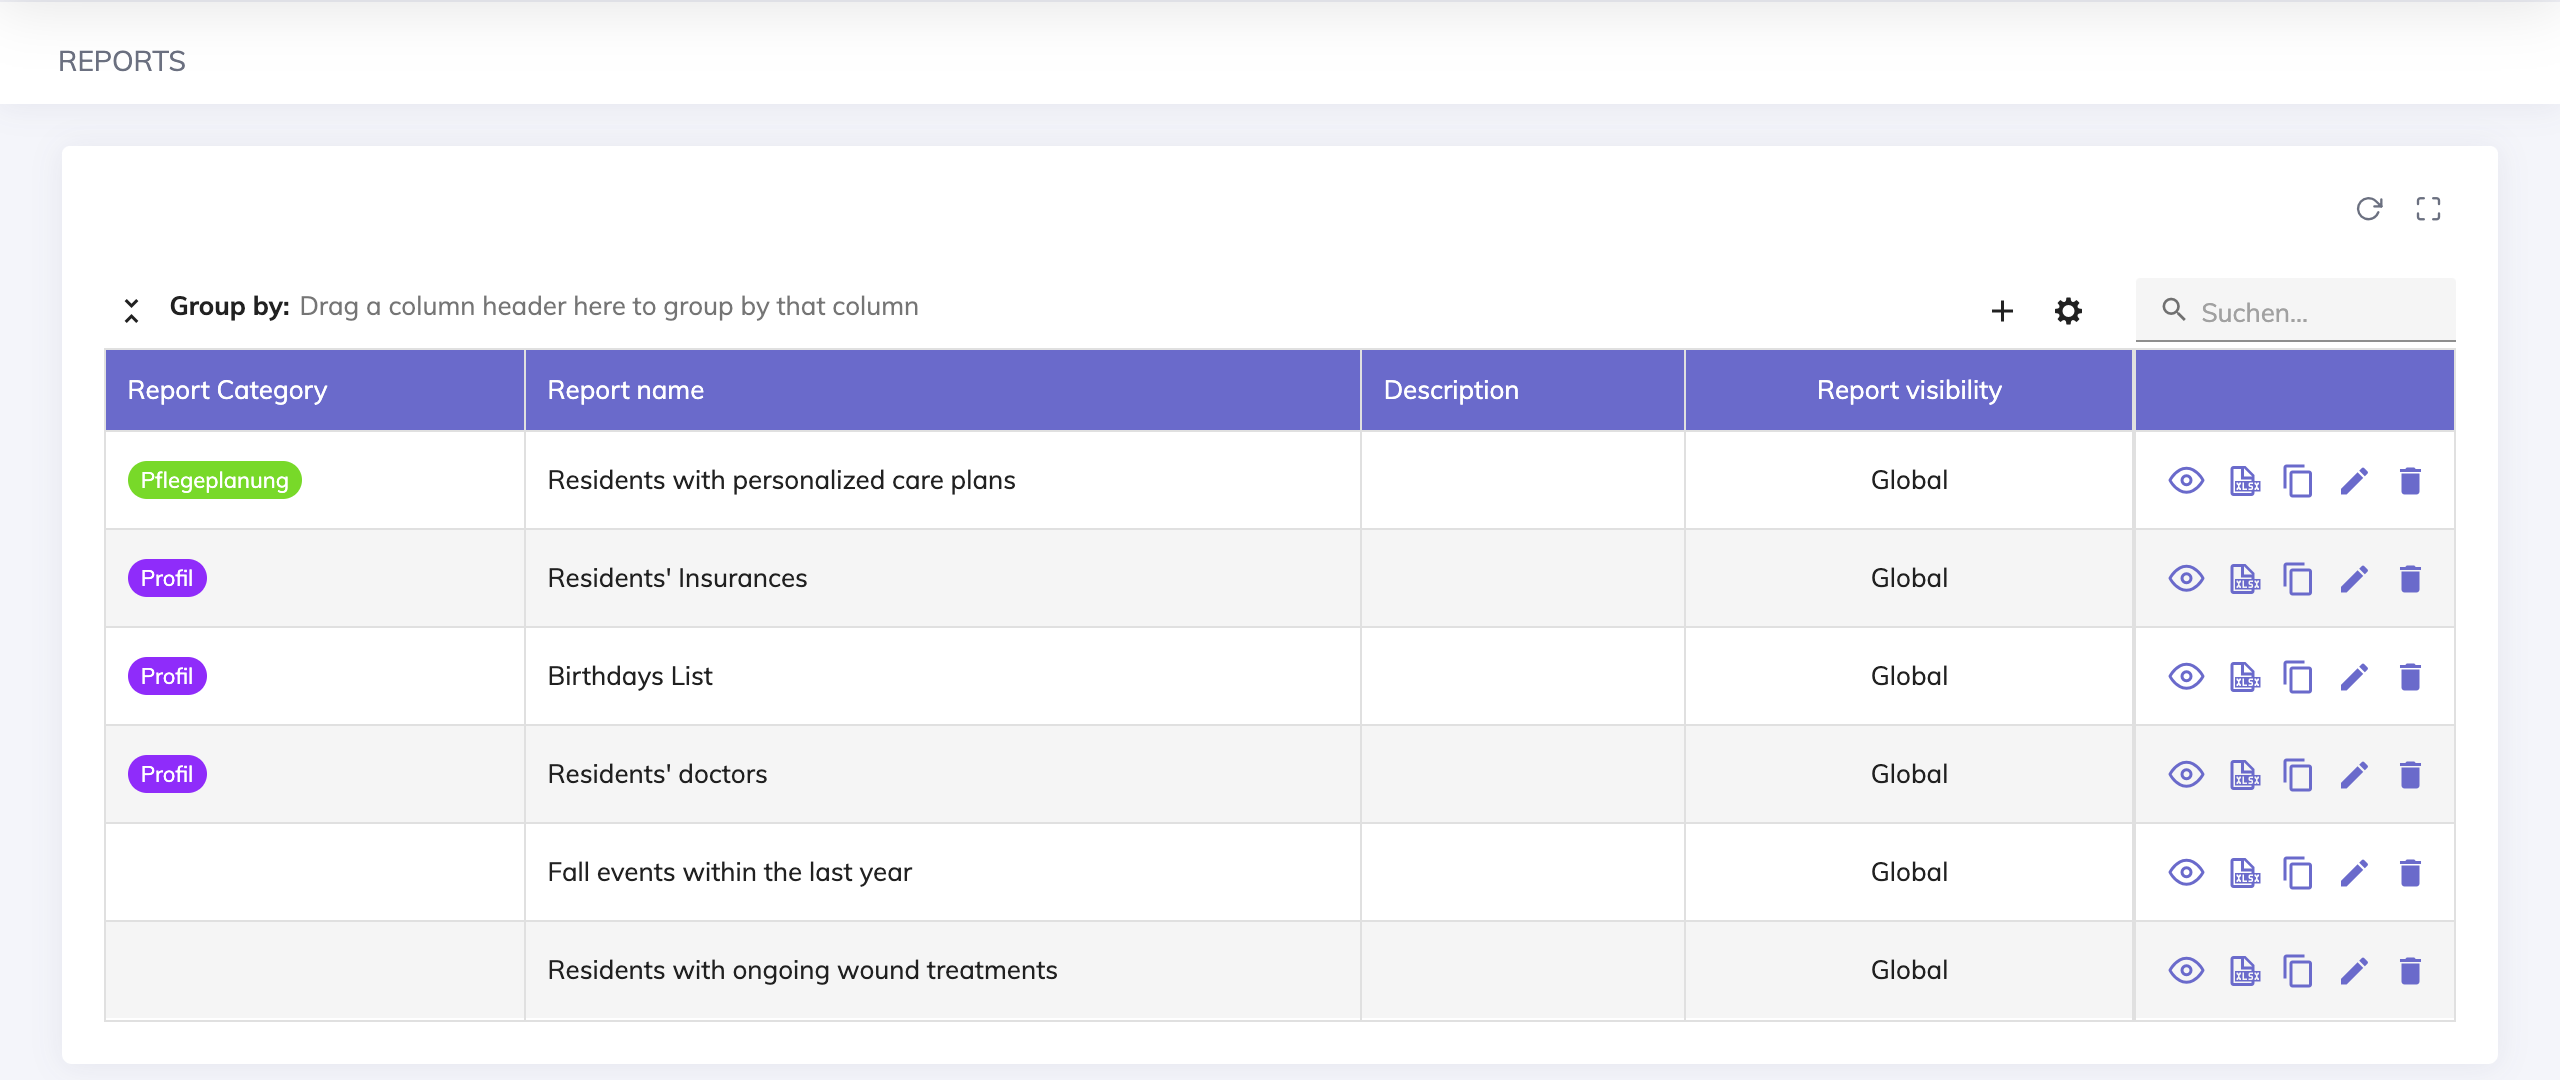
On the Reports Page, you will find an overview table with a list of reports. The following functions are available on the table:
Creating new reports (plus icon)
Creating new report categories (gear icon) - this helps in grouping similar reports together
Search by report name or description
Viewing the report results (eye icon)
Exporting to excel (excel icon)
Making a copy of an existing report (duplicate icon)
Editing the report properties (pencil icon)
Deleting a report (trash icon)
You can distinguish reports from each other by organizing them into categories. You can create custom report categories as follows:
Based on the purpose, you can assign reports to one of the available categories - we'll see this in the next step.
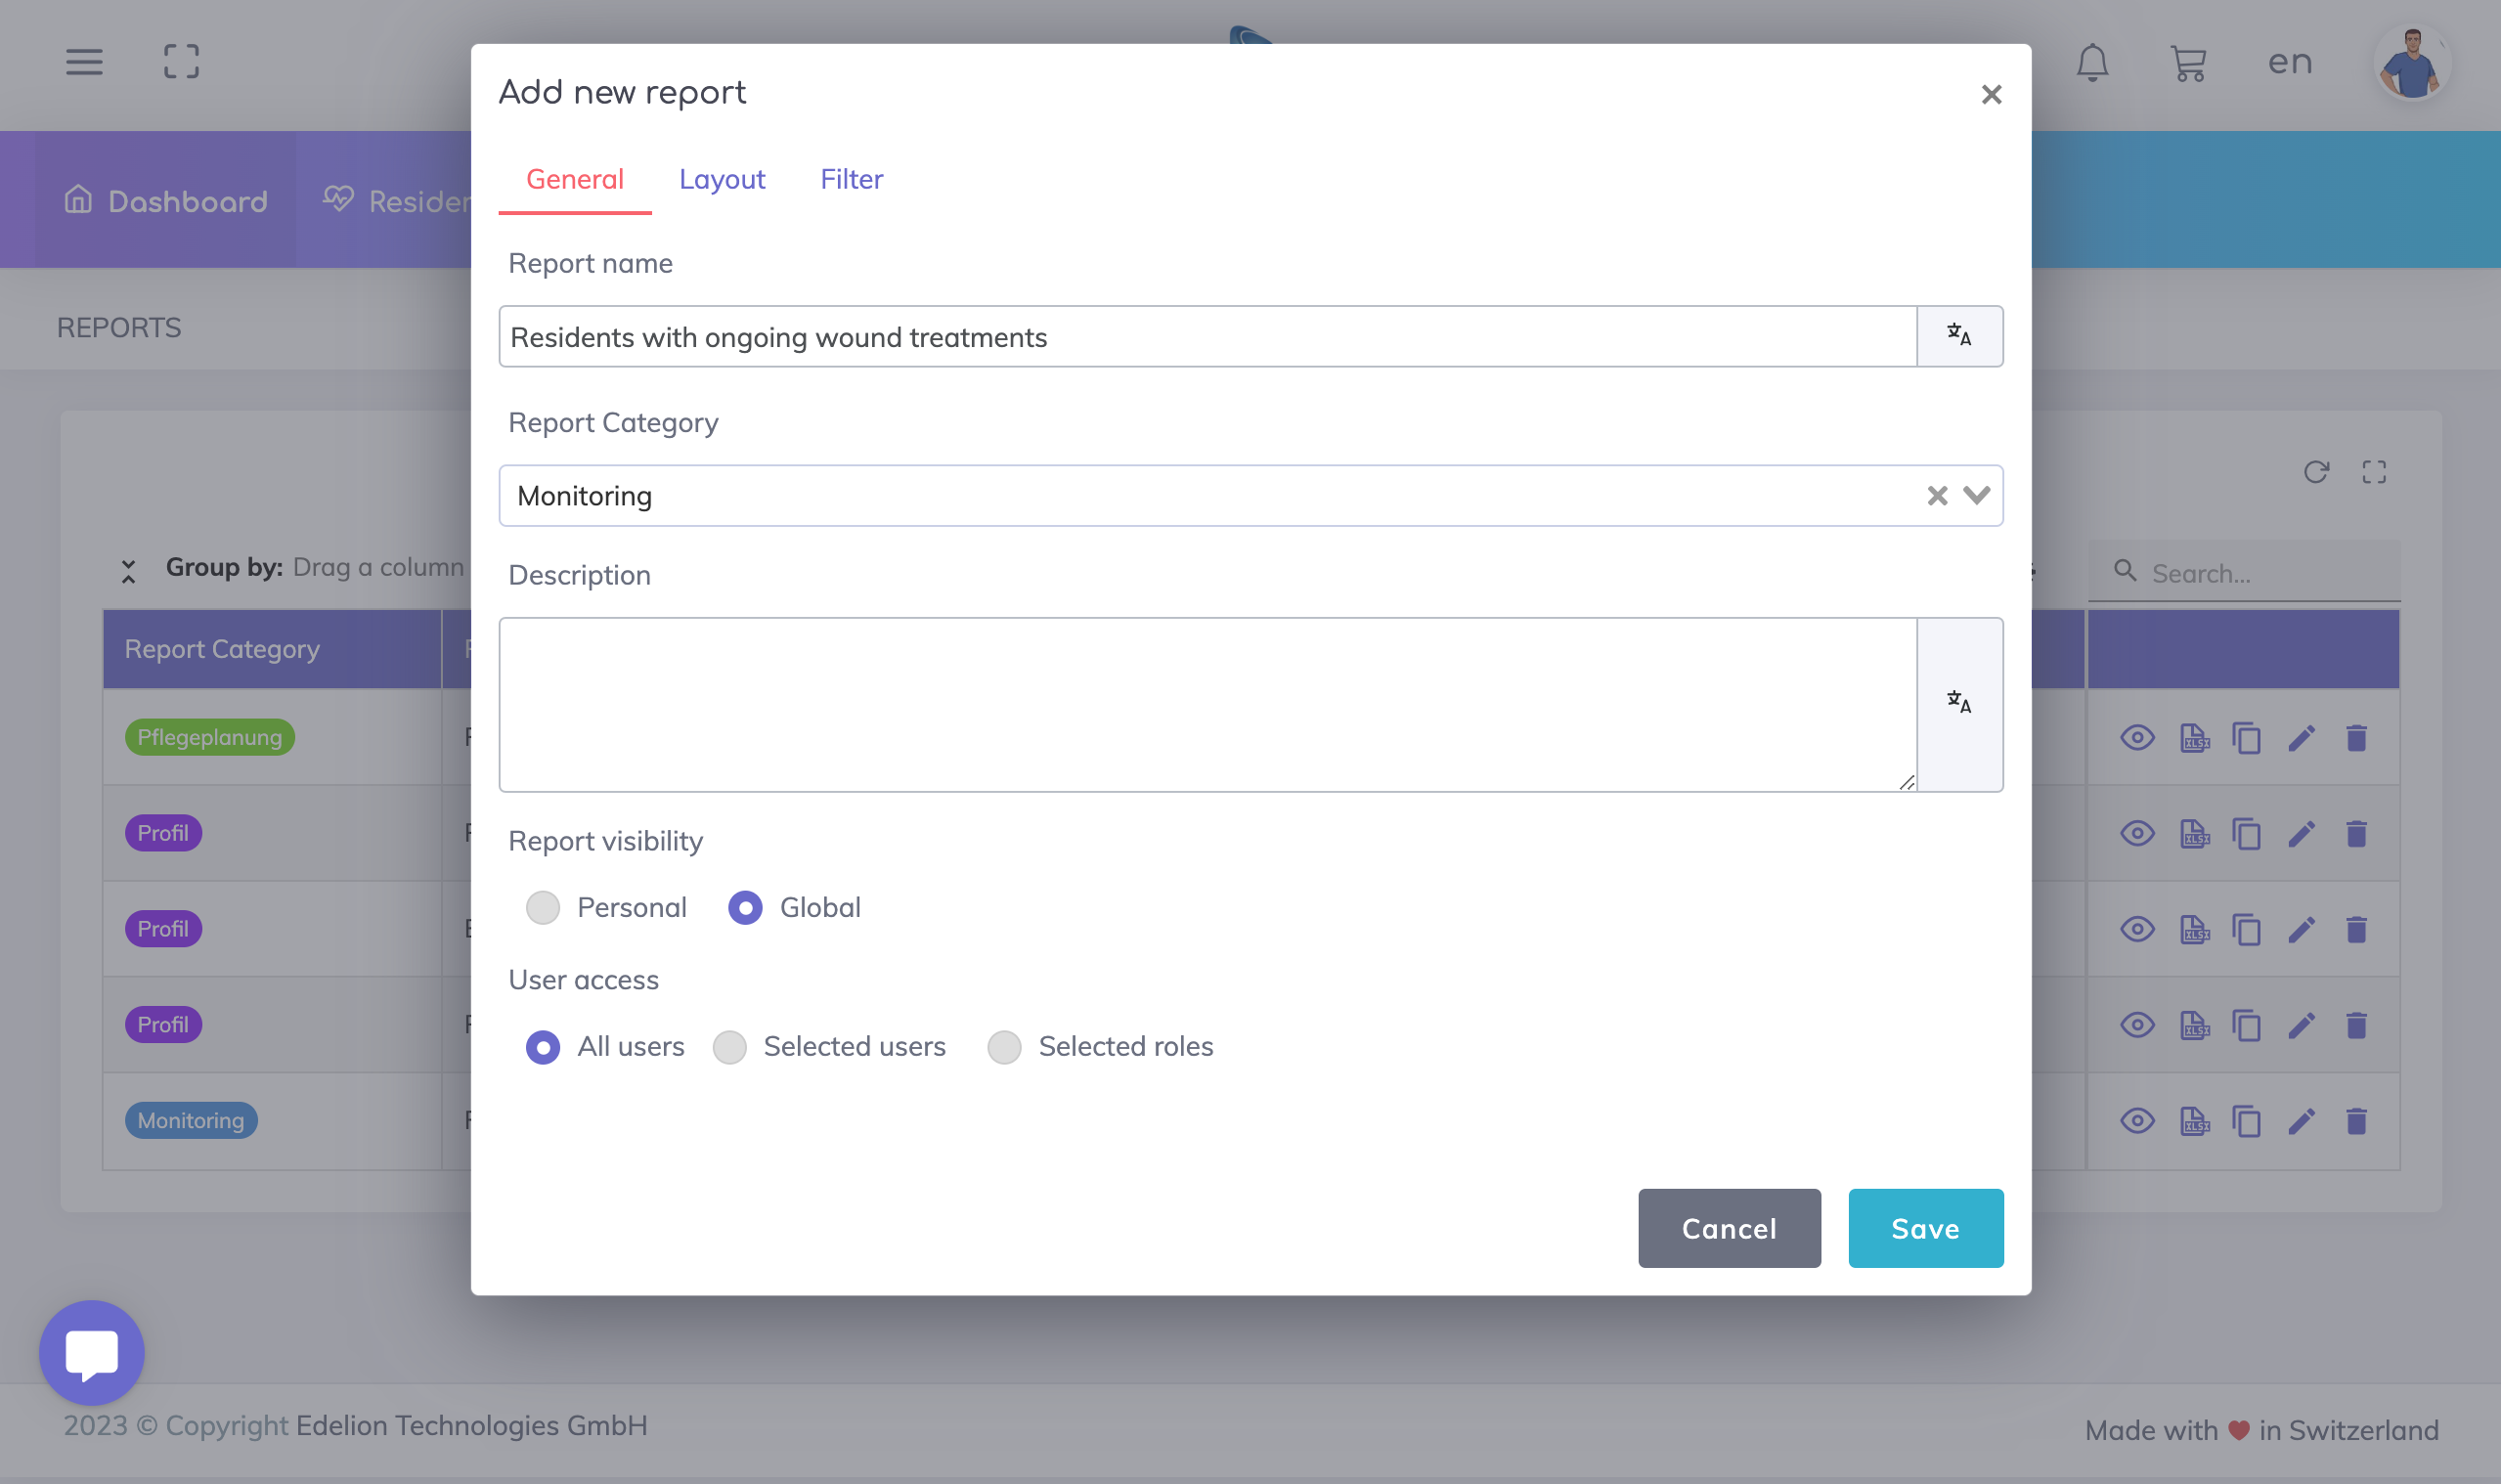
On the General Tab, enter the name and description of the report. Assign the category that you created in the previous step.
The report offers two visibility options:
Personal - choose this if the report should be visible exclusively for you.
Global - with this option, you may provide access to this report to all the users, to specific users or to users with specific user roles.
In this example, let's start by creating a global report (available to all users) to show all residents who have ongoing wound treatments.
On the Layout tab, click on the search bar to display the list of fields available. Scroll and select a field or search for a field by typing. The order of fields may be changed using the hamburger icon appearing on the left hand side.
Applying filters enable you to narrow down the data based on criteria such as date ranges, statuses, or specific values.
Click on the + sign to add a condition or a group of conditions. Let's start off with adding individual conditions.

Note: By default the conditions are combined with the logical operator AND. You may change this to use the logical operator OR by clicking on the AND operator.
Now, let's extend the above scenario by adding a group of conditions. For example, if we want to only view the residents in specific departments, we will add a group and we will use the OR operator as shown. However the parent conditions are still combined with the AND operator.
To access the report, please click on the eye icon located on the overview table. Additionally, you have the option to filter data directly on any column field within the table or group the data by a specific field. It is important to note that any layout modifications made directly on the table will not be retained. Thus, upon each subsequent access of the report, sorting and grouping of data will be required based on your preferences. However, if you wish to ensure that these layout changes are remembered for future use, kindly update this on the Layout tab of the Report properties.

If there are any additional fields necessary for the report layout or for the purpose of filtering the report data, we kindly request you to inform us accordingly.
We're here to help. Please feel free to contact us.